Which Milwaukee neighborhood has the most bus stops?

Bay View has the most bus stops of any City of Milwaukee neighborhood, with 89 bus stops.

The top 5 City neighborhoods have 14.4% of the City's 2,539 bus stops. Count by residents and Maitland Park is highest, with 16.9 per 1,000 residents, and it ranks 80th by plain count.
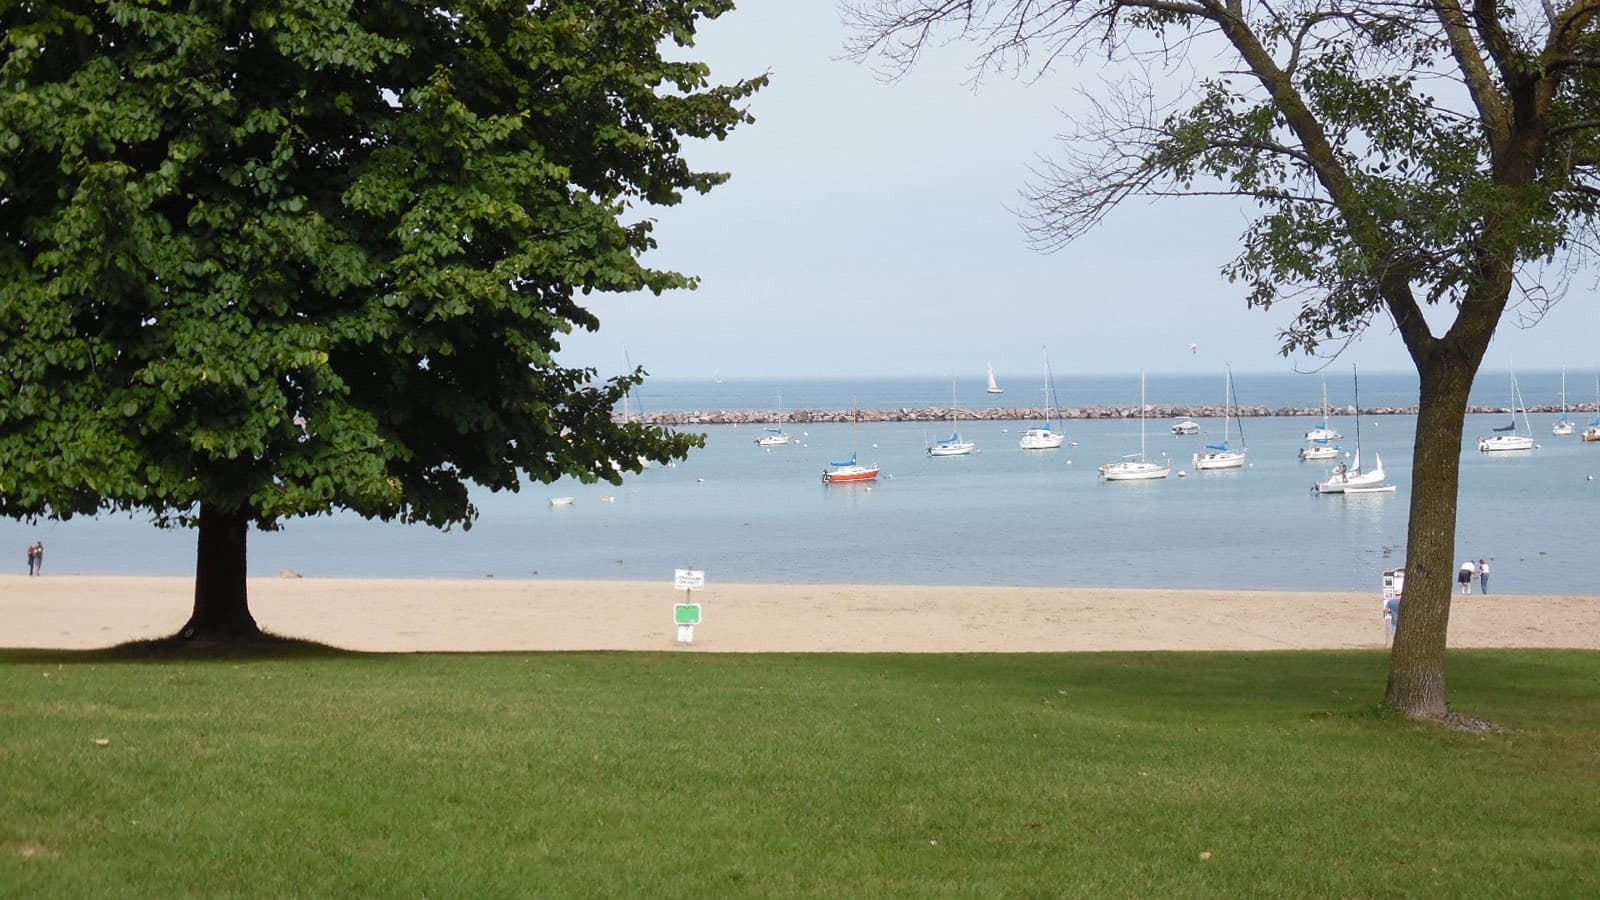
Bay View, ranked 1st of 164
Bay View, ranked 1st of 164. Photo: Akaila of the Willows, CC0
Highest
Bay View
89
Middle City neighborhood
11
Of 164 ranked
Metric
MCTS bus stops
Year
As of November 3, 2026
Source
Milwaukee County Transit System (MCTS) GTFS feed

Milwaukee County by mCTS bus stops

Darker means a higher number. Lake Michigan is on the right. Press a shape to open that neighborhood.

Bayside: 2Brown Deer: 35Cudahy: 64Fox Point: 9Franklin: 7Glendale: 62Greendale: no figure on this pageGreenfield: 125Hales Corners: 7Oak Creek: 51River Hills: 2Shorewood: 49South Milwaukee: 53St. Francis: 36Wauwatosa: 217West Allis: 306West Milwaukee: 27Whitefish Bay: 38Alcott Park: 1Alverno: 5Amani: 34Arlington Gardens: 15Arlington Heights: 21Avenues West: 28Baran Park: 2Bay View: 89Bluemound Heights: 5Borchert Field: 14Bradley Estates: 8Brewer's Hill: 7Brown Deer Park: no figure on this pageBrynwood: 6Buchel Park: no figure on this pageBurnham Park: 31Calumet Farms: 3Cambridge Heights: 4Cannon Park: 13Capitol Heights: 35Castle Manor: 14Clarke Square: 20Clayton Crest: 4Clock Tower Acres: 11Cold Spring Park: 9College Heights: 6Columbus Park: 17Concordia: 12Cooper Park: 12Copernicus Park: 2Dineen Park: 31Downer Woods: 17Dretzka Park: 3Enderis Park: 16Estabrook Park: 3Euclid Park: 6Fair Park: 11Fairfield: 19Fairview: 7Fernwood: 8Florist Highlands: no figure on this pageForest Home Hills: 24Franklin Heights: 37Freedom Village: 1Garden Homes: 19Golden Gate: no figure on this pageGolden Valley: 7Goldman Park: 3Gra-Ram: 6Graceland: 16Grantosa: 5Granville Station: 10Granville Woods: no figure on this pageGrasslyn Manor: 12Green Moor: 6Grover Heights: 6Halyard Park: 12Hampton Heights: 28Harambee: 70Harbor View: 7Harder's Oaks: 1Havenwoods: 10Hawley Farms: 5Hawthorne Glen: 3Haymarket: 7Heritage Heights: no figure on this pageHighwood Estates: 5Hillside: 8Hilltop Parish: no figure on this pageHistoric Mitchell Street: 44Historic Third Ward: 4Holler Park: 1Honey Creek Manor: 3Jackson Park: 39Johnson's Woods: 6Juneau Town: 31Kilbourn Town: 40King Park: 21Kops Park: 8Lake Park: no figure on this pageLayton Park: 34Lenox Heights: 6Lincoln Creek: 26Lincoln Park: 33Lincoln Village: 28Lindsay Park: 16Long View: 16Lower East Side: 46Lyons Park: 5Mack Acres: no figure on this pageMaitland Park: 11Maple Tree: 11Marquette: 6Martin Drive: 12McGovern Park: 13Melody View: 2Menomonee River Hills East: 22Menomonee River Hills: 26Menomonee River Valley: 15Merrill Park: 10Metcalfe Park: 17Midtown: 36Mill Valley: no figure on this pageMiller Valley: 17Mitchell Park: 2Mitchell West: 24Morgan Heights: 6Morgandale: 28Mount Mary: 16Mount Olivet: 5Murray Hill: 15Muskego Way: 28Nash Park: 8National Park: 9New Coeln: 4North Division: 57North Granville: no figure on this pageNorthpoint: 13Northridge Lakes: 4Northridge: 18Old North Milwaukee: 88Park Knoll: no figure on this pagePark Place: 7Park View: 3Parkway Hills: 2Pheasant Run: no figure on this pagePollber Heights: 2Polonia: 19Red Oak Heights: 2Ridgeview: no figure on this pageRiver Bend: 5Riverside Park: 6Riverton Heights: no figure on this pageRiverwest: 61Rolling Green: 2Roosevelt Grove: 27Root Creek: 9Rufus King: 24Saint Joseph: 25Saveland Park: 4Schlitz Park: 7Servite Woods: 1Sherman Park: 45Silver City: 13Silver Spring: 49Silver Swan: 9Southgate: 22Southpoint: 8St. Amelian's: 4Story Hill: 8Sunset Heights: 12The Valley/Pigsville: no figure on this pageThurston Woods: 20Timmerman West: 20Tippecanoe: 14Town & Country Manor: 12Town of Lake: 13Triangle North: 17Triangle: 8Tripoli Park: 8Upper East Side: 10Uptown: 29Valhalla: 18Valley Forge: no figure on this pageVogel Park: 17Wahl Park: 8Walker's Point: 45Walnut Hill: 10Washington Heights: 14Washington Park: 34Wedgewood: 2West View: 5Whispering Hills: 4White Manor: 3Wick Field: 9Williamsburg: 22Wilson Park: 15Woodland Court: 1Woodlands: 3Wyrick Park: 4Yankee Hill: 11Old North Milwaukee882Harambee703Bay View891
  1. 1 Bay View: 89
  2. 2 Old North Milwaukee: 88
  3. 3 Harambee: 70
  • 1 to 4
  • 5 to 7
  • 8 to 14
  • 15 to 27
  • 28 to 306
  • None on record or no figure

MCTS bus stops, as of November 3, 2026. Each color holds about the same number of neighborhoods. The heavy line is the City of Milwaukee boundary.

City of Milwaukee neighborhoods

MCTS bus stops, as of November 3, 2026. 17 City neighborhoods aren't in this table: no MCTS stop is inside their boundary.

Bay View1895.62.5%
Old North Milwaukee2888.22.4%
Harambee3706.01.9%
Riverwest4615.61.7%
North Division55713.01.6%
Silver Spring6494.01.4%
Lower East Side7464.01.3%
Sherman Park8457.51.2%
Walker's Point8456.51.2%
Historic Mitchell Street10444.31.2%
Kilbourn Town11407.61.1%
Jackson Park12394.91.1%
Franklin Heights13375.71.0%
Midtown14366.31.0%
Capitol Heights15355.51.0%
Amani16348.10.9%
Layton Park16344.10.9%
Washington Park16349.20.9%
Lincoln Park19336.30.9%
Burnham Park20313.70.9%
Dineen Park20319.00.9%
Juneau Town20315.40.9%
Uptown23295.20.8%
Avenues West24283.40.8%
Hampton Heights24283.70.8%
Lincoln Village24282.40.8%
Morgandale24283.20.8%
Muskego Way24282.50.8%
Roosevelt Grove29275.20.7%
Lincoln Creek30263.30.7%
Menomonee River Hills30262.80.7%
Saint Joseph32254.20.7%
Forest Home Hills33244.70.7%
Mitchell West33246.80.7%
Rufus King33245.40.7%
Menomonee River Hills East36229.30.6%
Southgate36228.20.6%
Williamsburg362213.00.6%
Arlington Heights39215.00.6%
King Park39219.30.6%
Clarke Square41202.70.6%
Thurston Woods41206.30.6%
Timmerman West41204.80.6%
Fairfield44195.90.5%
Garden Homes44197.80.5%
Polonia44193.00.5%
Northridge471813.90.5%
Valhalla47185.10.5%
Columbus Park49174.10.5%
Downer Woods49173.50.5%
Metcalfe Park49177.10.5%
Miller Valley491713.90.5%
Triangle North491713.20.5%
Vogel Park49178.40.5%
Enderis Park55165.10.4%
Graceland55167.70.4%
Lindsay Park55163.40.4%
Long View55165.70.4%
Mount Mary55167.70.4%
Arlington Gardens60157.80.4%
Menomonee River Valley60156.10.4%
Murray Hill60153.90.4%
Wilson Park60153.70.4%
Borchert Field64144.60.4%
Castle Manor64143.90.4%
Tippecanoe64142.30.4%
Washington Heights64142.10.4%
Cannon Park68136.50.4%
McGovern Park68133.90.4%
Northpoint68132.40.4%
Silver City68133.00.4%
Town of Lake68132.50.4%
Concordia73124.60.3%
Cooper Park73124.00.3%
Grasslyn Manor73122.60.3%
Halyard Park731212.10.3%
Martin Drive73129.80.3%
Sunset Heights73123.40.3%
Town & Country Manor73127.10.3%
Clock Tower Acres801113.10.3%
Fair Park80119.40.3%
Maitland Park801116.90.3%
Maple Tree80115.80.3%
Yankee Hill80113.10.3%
Granville Station85106.10.3%
Havenwoods85107.60.3%
Merrill Park85103.60.3%
Upper East Side85103.10.3%
Walnut Hill85104.80.3%
Cold Spring Park9094.50.2%
National Park9094.50.2%
Root Creek9094.20.2%
Silver Swan9092.30.2%
Wick Field90912.00.2%
Bradley Estates9583.80.2%
Fernwood9582.60.2%
Hillside9584.90.2%
Kops Park9583.10.2%
Nash Park9583.70.2%
Southpoint9582.30.2%
Story Hill9584.80.2%
Triangle95812.80.2%
Tripoli Park95814.70.2%
Wahl Park9583.20.2%
Brewer's Hill10573.00.2%
Fairview10571.90.2%
Golden Valley10572.60.2%
Harbor View10573.60.2%
Haymarket105710.40.2%
Park Place10575.70.2%
Schlitz Park105711.60.2%
Brynwood11264.40.2%
College Heights11266.30.2%
Euclid Park11263.10.2%
Gra-Ram11262.90.2%
Green Moor11267.60.2%
Grover Heights11260.2%
Johnson's Woods11262.10.2%
Lenox Heights11263.00.2%
Marquette11263.90.2%
Morgan Heights11263.80.2%
Riverside Park11263.00.2%
Alverno12354.30.1%
Bluemound Heights12351.60.1%
Grantosa12353.20.1%
Hawley Farms12353.80.1%
Highwood Estates12352.10.1%
Lyons Park12352.60.1%
Mount Olivet12355.80.1%
River Bend12353.00.1%
West View12352.80.1%
Cambridge Heights13242.60.1%
Clayton Crest13242.00.1%
Historic Third Ward13242.50.1%
New Coeln13240.1%
Northridge Lakes13241.70.1%
Saveland Park13243.40.1%
St. Amelian's13242.60.1%
Whispering Hills13240.1%
Wyrick Park13241.90.1%
Calumet Farms14132.40.1%
Dretzka Park14133.60.1%
Estabrook Park14130.1%
Goldman Park14131.90.1%
Hawthorne Glen14130.1%
Honey Creek Manor14131.10.1%
Park View14130.1%
White Manor14131.80.1%
Woodlands14131.10.1%
Baran Park15022.90.1%
Copernicus Park15021.30.1%
Melody View15020.1%
Mitchell Park15020.1%
Parkway Hills15022.40.1%
Pollber Heights15020.1%
Red Oak Heights15022.50.1%
Rolling Green15020.80.1%
Wedgewood15021.40.1%
Alcott Park15910.70.0%
Freedom Village15910.0%
Harder's Oaks15911.60.0%
Holler Park15911.60.0%
Servite Woods15911.40.0%
Woodland Court15911.00.0%

Suburbs

West Allis13065.18.4%
Wauwatosa22174.56.0%
Greenfield31253.43.4%
Cudahy4643.61.8%
Glendale5624.51.7%
South Milwaukee6532.61.5%
Oak Creek7511.41.4%
Shorewood8493.61.4%
Whitefish Bay9382.61.0%
St. Francis10364.01.0%
Brown Deer11352.81.0%
West Milwaukee12276.70.7%
Fox Point1391.30.2%
Franklin1470.20.2%
Hales Corners1470.90.2%
Bayside1620.50.1%
River Hills1621.20.1%

How we measured this

We count the stops in the Milwaukee County Transit System schedule feed by the neighborhood boundary each stop is inside.

What would change the answer

A stop counts once however many routes use it, and a stop on a boundary street counts on one side only. Schedules change a few times a year.

This page as markdown or JSON.

Your heart is counted. Counts on this page refresh when it is next built.

Your heart is removed. Counts on this page refresh when it is next built.

Your vote is saved. Press the same button again to remove it. Counts on this page refresh when it is next built.

Too many votes right now. Try again later. Counts on this page refresh when it is next built.

That vote could not be saved. Counts on this page refresh when it is next built.