Which Milwaukee neighborhood has the most gyms and yoga studios?
The Lower East Side has the most gyms and yoga studios of any City of Milwaukee neighborhood, with 7 gyms and yoga studios.
Count by residents and the Historic Third Ward comes first, at 3.8 per 1,000, even though it ranks 2nd by plain count. Juneau Town has the most businesses overall and ranks only 8th here.
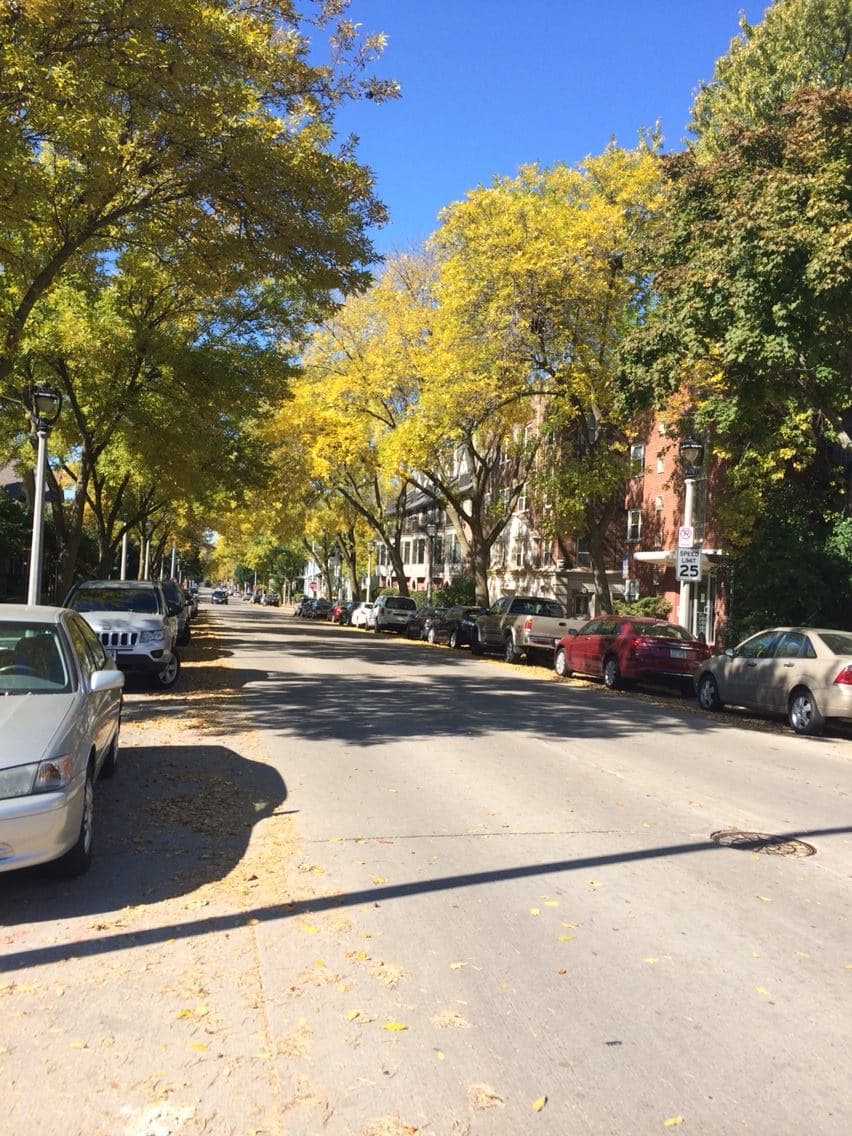

- Middle City neighborhood
- 1
- Of 23 ranked
- Metric
- Records in the gyms and yoga studios category
- Year
- As of November 3, 2026
Milwaukee County by records in the gyms and yoga studios category
Darker means a higher number. Lake Michigan is on the right. Press a shape to open that neighborhood.
- 1 Lower East Side: 7
- 2 Historic Third Ward: 6
- 3 Kilbourn Town: 4
- 1
- 2 to 3
- 4 to 12
- None on record or no figure
Records in the gyms and yoga studios category, as of November 3, 2026. Each color holds about the same number of neighborhoods. The heavy line is the City of Milwaukee boundary.
City of Milwaukee neighborhoods
Records in the gyms and yoga studios category, as of November 3, 2026. 158 City neighborhoods aren't in this table: no record in this category is inside their boundary.
23 of 23
No matches on this page.
| Lower East Side | 1 | 7 | 0.6 |
|---|---|---|---|
| Historic Third Ward | 2 | 6 | 3.8 |
| Kilbourn Town | 3 | 4 | 0.8 |
| Washington Heights | 3 | 4 | 0.6 |
| Bay View | 5 | 3 | 0.2 |
| Capitol Heights | 6 | 2 | 0.3 |
| Walker's Point | 6 | 2 | 0.3 |
| Freedom Village | 8 | 1 | |
| Green Moor | 8 | 1 | 1.3 |
| Jackson Park | 8 | 1 | 0.1 |
| Juneau Town | 8 | 1 | 0.2 |
| Menomonee River Hills East | 8 | 1 | 0.4 |
| Menomonee River Valley | 8 | 1 | 0.4 |
| Mitchell West | 8 | 1 | 0.3 |
| Murray Hill | 8 | 1 | 0.3 |
| Muskego Way | 8 | 1 | 0.1 |
| Northpoint | 8 | 1 | 0.2 |
| Riverwest | 8 | 1 | 0.1 |
| Sherman Park | 8 | 1 | 0.2 |
| Southpoint | 8 | 1 | 0.3 |
| Triangle North | 8 | 1 | 0.8 |
| Wick Field | 8 | 1 | 1.3 |
| Yankee Hill | 8 | 1 | 0.3 |
Suburbs
| Wauwatosa | 1 | 12 | 0.2 |
|---|---|---|---|
| Oak Creek | 2 | 7 | 0.2 |
| Shorewood | 3 | 6 | 0.4 |
| Franklin | 4 | 5 | 0.1 |
| Greenfield | 5 | 4 | 0.1 |
| Hales Corners | 6 | 3 | 0.4 |
| West Allis | 6 | 3 | 0.1 |
| Glendale | 8 | 2 | 0.1 |
| South Milwaukee | 8 | 2 | 0.1 |
| St. Francis | 8 | 2 | 0.2 |
| Whitefish Bay | 8 | 2 | 0.1 |
| Cudahy | 12 | 1 | 0.1 |
| Fox Point | 12 | 1 | 0.1 |
How we measured this
We count the business records we've placed in the gyms and yoga studios category, by the neighborhood boundary each address is inside.
What would change the answer
A record's category comes from its license and from public sources, and we don't have a category for every record. So the true count can be higher where more records have no category.